Basics
A <- c(1:10)creates the list (1,2,3,...,10) and assigns it to variable A.sum(A),mean(A),min(A), andmax(A)do what you expect.A^2andA-mean(A)produce lists; what doesmean((A-mean(A))^2)produce?- What do
var(A)andsd(A)produce?
Distributions
R has many built-in distributions. Each distribution can be accessed using functions with one of 4 prefixes: d, p, q, or r. They refer to density/mass, cumulative probability, quantile, and sampling. Try the following:
pdf <- dbinom(c(1:16), 16, 0.7)barplot(pdf, main="Binomial probabilities; n=16 p=0.7", xlab="Number of successes", names.arg=c(1:16))for (p in c(.005, .025, .05)){print(qnorm(1-p))}rand <- rnorm(100, 50, 4)hist(rand)qqnorm(rand)- Generate 99%, 95%, and 90% confidence intervals for the mean based on
rand
The power function problem
In class we looked at using a random sample of size 16 from a Bernoulli population to test the null hypothesis H0: θ = 0.75 against the alternative H1: θ ≠ 0.75. We decided to reject the H0 in favor of H1 if X, the total number of successes in our sample, was any number other than 11, 12, or 13. Your first job is to get R to give you a graph of the power function of this test. Then do the same, but with a different critical region: reject H0 if X isn't 12, 13, or 14. Compare the power functions of the tests. Some sample code to help you get going:
x <- seq(0, 1, length=101)y <- pbinom(10, 16, x)plot(x, y, type='l')
Data input
scan()can be a nice way to enter lists (manually or copy and paste).read.csv('filename.csv')andread.table('filename.txt', sep='\t', header=TRUE)are useful for getting existing data into R.- You may need to change the working directory using
setwd("path/to/desired/directory")(you can check on the working directory usinggetwd()). - Download 422-S18 Height data and give it a better name (like height.csv).
- Load the data into R and name it h:
h <- read.csv('height.csv'). - Give the columns better names:
colnames(h) <- c("Back", "Front"). summary(h)summarizes the data.plot(stack(h)[, 2:1])gives us a boxplot.t.test(h$Back, h$Front)runs a hypothesis test.- Kaggle seems like an interesting source of data (login required).
Linear regression
- Load scores.csv into R (if not already loaded):
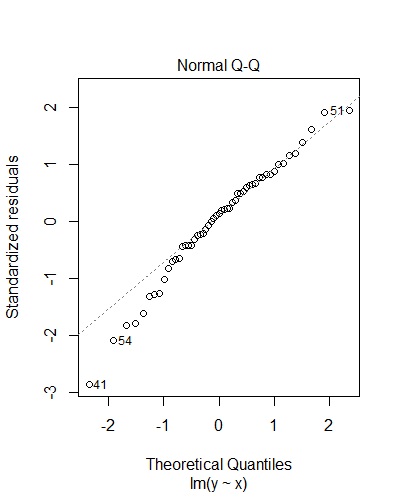
scores<-read.csv('scores.csv') plot(scores$A1,scores$A4, col="blue", main="Scores on Exam 1 and Exam 4 in Math 157", xlab="Exam 1 Score", ylab="Exam 4 score")m<-lm(scores$A4~scores$A1)abline(m)summary(m)plot(m)- Repeat for section B
- Repeat for the combined scores of both sections
> summary(m)

Call:
lm(formula = y ~ x)

Residuals:
    Min      1Q  Median      3Q     Max
-33.674  -5.261   1.626   7.764  22.590

Coefficients:
            Estimate Std. Error t value Pr(>|t|)
(Intercept)  21.3822     8.9714   2.383   0.0209 *
x             0.7125     0.1119   6.369  5.4e-08 ***
---
Signif. codes:  0 ‘***’ 0.001 ‘**’ 0.01 ‘*’ 0.05 ‘.’ 0.1 ‘ ’ 1

Residual standard error: 11.89 on 51 degrees of freedom
  (7 observations deleted due to missingness)
Multiple R-squared:  0.443,	Adjusted R-squared:  0.4321
F-statistic: 40.56 on 1 and 51 DF,  p-value: 5.396e-08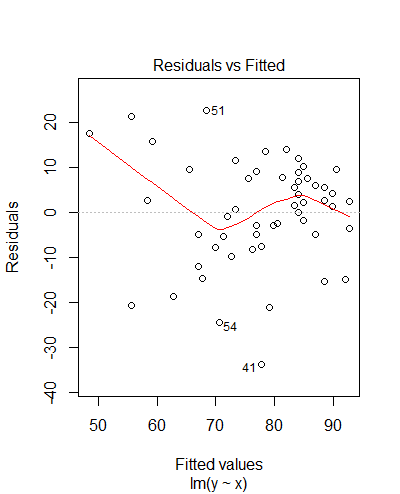
- Multiple linear regression is also possible. Here LE is Life Expectancy, CU is the rate of Contraceptive Use, and H is Health care expenditures (all from the CIA World Factbook). Be careful of confounding.
> summary(model) Call: lm(formula = data$LE ~ data$CU + data$H) Residuals: Min 1Q Median 3Q Max -22.3880 -2.8498 0.3035 3.3646 16.8333 Coefficients: Estimate Std. Error t value Pr(>|t|) (Intercept) 56.10052 1.63577 34.296 <2e-16 *** data$CU 0.24304 0.02562 9.485 <2e-16 *** data$H 0.24974 0.19161 1.303 0.195 - The Hmisc library gives a nice way of looking at the correlations between our variables.
    > rcorr(as.matrix(data[2:4]))

	LE   CU    H
    LE 1.00 0.66 0.25
    CU 0.66 1.00 0.25
    H  0.25 0.25 1.00

    n= 134

    P
       LE     CU     H
    LE        0.0000 0.0035
    CU 0.0000        0.0030
    H  0.0035 0.0030
Analysis of variance
- Download old height data and load it into R:
h <- read.csv("height_data.csv") - I found it helpful to rename the columns:
colnames(h) <- c("section", "sex", "c", "m", "f") - Interpret the results of
model <- lm(h$c~h$m+h$f) - Load the Hmisc library (
library(Hmisc)) and determine if the output ofrcorr(as.matrix(h[3:5]))affects your analysis of the previous linear regression model - Fit a model (
m <- lm(h$c~h$sex)) and comparesummary(m),anova(m), andt.test(h[h$sex == "M", 3], h[h$sex == "F", 3]) - Use a summary or an ANOVA to interpret
lm(h$m~h$sex) - Compare
plot(h$c~h$sex)andplot(h$m~h$sex) lm(c~section+sex, data=h)should allow you to run a 2-way ANOVA- Run a 2-way ANOVA on the lion hunting data in R HW 1
- Check the validity of your models (using
plot(model)and/orhist(residuals(model))) - For more, see this summary from Columbia University
Non-parametric tests
- I've heard that the average Gonzaga student lives less than 200 miles from Gonzaga. Assume the class constitutes a random sample and test the claim. Use a t test if the data seems to be approximately normal (
histandqqnormmight be useful). Otherwise useWilcox.test(you might usehelp(wilcox.test)to see how the test works). - The
immerdata set gives barley yields for 2 years (1931 and 1932) in a variety of fields and varieties. First load the data withlibrary(MASS)and look at the structure withhead(immer). I'd like to know if the two years had the same average yield. Which of the following tests should I use?t.test(immer$Y1, immer$Y2)t.test(immer$Y1, immer$Y2, paired=T)t.test(immer$Y1-immer$Y2)wilcox.test(immer$Y1, immer$Y2)wilcox.test(immer$Y1, immer$Y2, paired=T)wilcox.test(immer$Y1-immer$Y2)
- The Wilcoxon test is appropriate for comparing two populations, as in this example
- The Kruskal-Wallis test compares multiple populations. Run
kruskal.test(immer$Y1~immer$Var)andkruskal.test(immer$Y1~immer$Loc)and interpret the results. (I always like to see plots, so I also runplot(immer$Y1~immer$Var)andplot(immer$Y1~immer$Loc)). - Compare
cor.test(immer$Y1, immer$Y2)withcor.test(immer$Y1, immer$Y2, method="spearman"). - What else can you do with this data?
Resources/Links
- R Companion
- R cheat sheet (credit to ?)
- Verzani's simpleR
- Dr. Burch's R notes
- Free intro to R (login required)
- Virtual Laboratories in Probability and Statistics
- Up to Math 422
Office hours
- Monday 1:30-2:30
- Tuesday 10:00-11:00 in the Math Lab
- Wednesday 1:30-2:30
- Thursday 10:00-11:00
- or by appointment

Logan Axon
Department of Mathematics
MSC 2615
Gonzaga University
Spokane, WA 99258
Office: Herak 307A
Phone: 509.313.3897
Email: axon@gonzaga.edu
Last updated 9/24/18