Combinatorics Project - Combinatorics in the world
So, we've studied a lot of combinatorics, and gotten very serious about digging into the depth of the subject.
Now, let's take a breath of fresh air and appreciate how combinatorics (even the easy stuff) can be a useful
lens through which to view a everything! We have seen a number of examples, from silly things (like picking my son's
dinner menus), to practical issues (like traveling the bridges of Spokane), and some much more poignant issues
(like studying the power of voting nations in the UN). See if you can find more.
Step 1: Go read a newspaper. Think about some current events in the world right now, and how
combinatorics can help analyze or understand a particular issue.
Step 2: Do some analysis. You've seen lots of applications of different combinatorial techniques. Try
to think creatively about how these techniques could apply to the problem you're thinking about.
Now, it's all well and good to have a deeper understanding of the problems facing the world, but it's even better if you
can present your findings in a meaningful way. With the availability of computing, infographics have become a highly
sophisticated and proliferate tool for communication of numerical information.
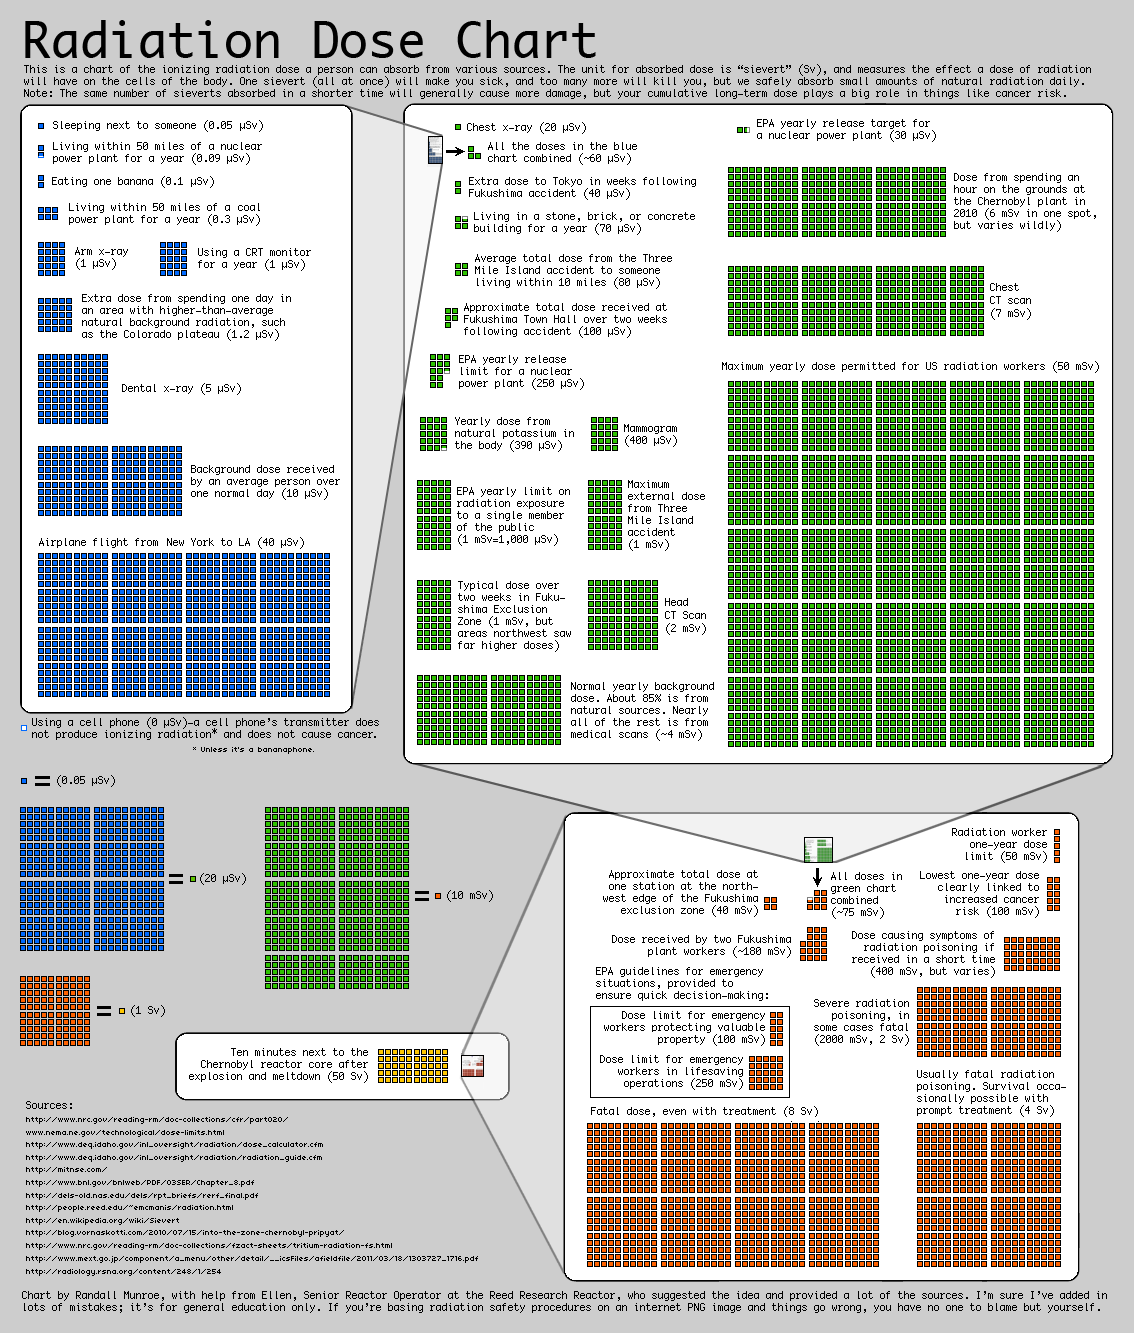
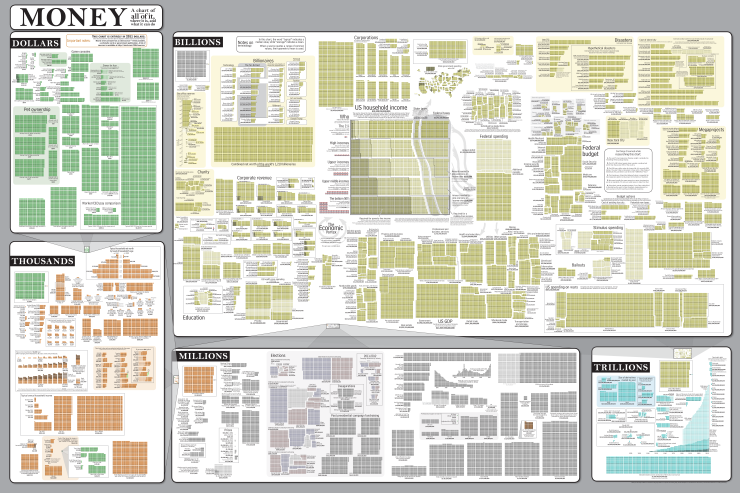
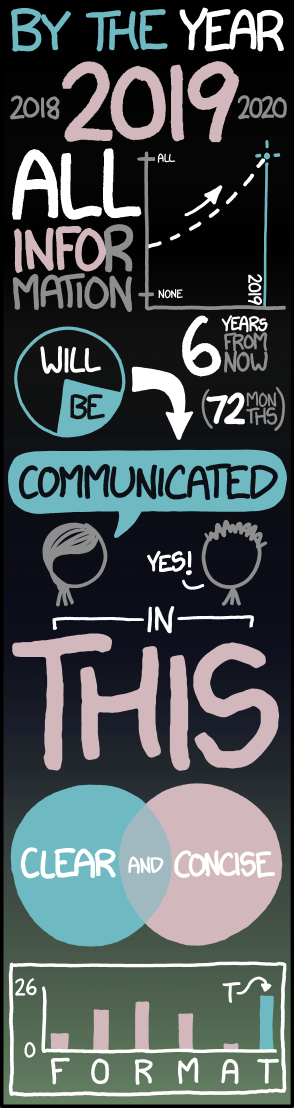
Here are a few silly examples:
But there is a lot that goes into infographics. Here's a nice discussion of some great examples of good infographics:
The Best Infographics of the Year:
Nate Silver on the 3 Keys to Great Information Design and the Line Between Editing and Censorship.
Have you noticed that a lot of these infographics use structures like graphs to communicate information? As we've seen
in our examples in class, graphs can be a great tool to show relationships between objects in a meaningful way. We've
also learned a lot about how analysis of the graph, and extra structures on the graph (coloring, directed arcs, weighted
edges) can give us meaningful information about our examples.
Step 3: Produce an infographic, presenting your analysis of your problem to the general public. You can use as much creative
license as you want here, but it should include a thoughtful mathematical analysis of a problem, and should communicate that analysis
in a meaningful way to a general audience. Your infographic does not need to explain the mathematics behind your analysis (I'll ask you
to write that up separately), but should communicate the results.
Final Product: You should turn in (preferably electronically) a finished product of an infographic, along with a short write up
(less than a page) explaining your infographic and the mathematics behind it. The infographic should be designed with a general
audience in mind. The write-up is meant for someone in this class to be able to read. All materials should be turned in by December 11.
You will be graded primarily on the mathematical analysis you conduct and on your ability to communicate that mathematics. However, you
are encouraged to think carefully about your creative design. We will share all the projects with the class and have a class vote for the
best infographic. There will be a small bonus for the winner.
Here are the results! Please email me by the end of the day Monday with your top 3 (ranked).