clearvars; close all; clc;
addpath('../../HspiceToolbox')
x = loadsig('./spiceout/C5_inverter_VTC_ngsp_bin.raw');
lssig(x)
vin = evalsig(x,'VOLTAGE');
vout = evalsig(x, 'out');
dvout = evalsig(x, 'dvout');
Vdd = max(vin);
Vo_mid = Vdd/2;
figure(1)
plot(vin,vin, 'linewidth',2);
hold;
plot(vin,vout, 'linewidth',2);
set(gca, 'Fontsize',14);
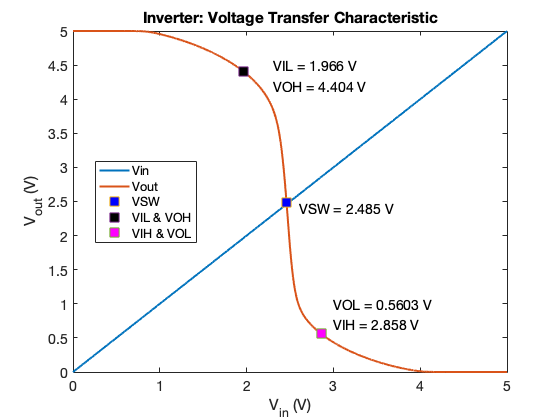
title('Inverter: Voltage Transfer Characteristic');
xlabel('V_{in} (V)');
ylim([0 5])
xlim([0 5])
ylabel('V_{out} (V)');
first_idx = find(dvout <= -1, 1, 'first');
VOH = vout(first_idx);
VIL = vin(first_idx);
second_idx = find(dvout <= -1, 1, 'last');
VOL = vout(second_idx);
VIH = vin(second_idx);
mid_idx = find(vout <= Vo_mid, 1, 'first');
VSW = vout(mid_idx);
fprintf("VTC parameters extracted from the VTC curve:\n");
fprintf("\tVSW = %.4g (V)\n", VSW);
fprintf("\tVIL = %.4g (V)\n", VIL);
fprintf("\tVIH = %.4g (V)\n", VIH);
fprintf("\tVOL = %.4g (V)\n", VOL);
fprintf("\tVOH = %.4g (V)\n", VOH);
str_vsw = sprintf("VSW = %.4g V", VSW);
text(2.6, 2.4, str_vsw, 'fontsize', 14)
p = plot(vin(mid_idx),vout(mid_idx),'s','MarkerFaceColor','blue', ...
'MarkerSize',12);
str_vil = sprintf("VIL = %.4g V", VIL);
str_voh = sprintf("VOH = %.4g V", VOH);
text(2.3, 4.5, str_vil, 'fontsize', 14)
text(2.3, 4.2, str_voh, 'fontsize', 14)
p = plot(vin(first_idx),vout(first_idx),'s','MarkerFaceColor','black', ...
'MarkerSize',12);
str_vih = sprintf("VIH = %.4g V", VIH);
str_vol = sprintf("VOL = %.4g V", VOL);
text(3, 1, str_vol, 'fontsize', 14)
text(3, 0.7, str_vih, 'fontsize', 14)
p = plot(vin(second_idx),vout(second_idx),'s','MarkerFaceColor','magenta', ...
'MarkerSize',12);
legend('Vin','Vout', 'VSW','VIL & VOH', 'VIH & VOL','location','best');
vsw_ngsp = evalsig(x, 'vsw');
vil_ngsp = evalsig(x, 'vil');
vih_ngsp = evalsig(x, 'vih');
voh_ngsp = evalsig(x, 'voh');
vol_ngsp = evalsig(x, 'vol');
VSW_SPICE = vsw_ngsp(1);
VIL_SPICE = vil_ngsp(1);
VIH_SPICE = vih_ngsp(1);
VOL_SPICE = vol_ngsp(1);
VOH_SPICE = voh_ngsp(1);
fprintf("VTC parameters extracted directly from SPICE:\n");
fprintf("\tVSW = %.4g (V)\n", VSW_SPICE);
fprintf("\tVIL = %.4g (V)\n", VIL_SPICE);
fprintf("\tVIH = %.4g (V)\n", VIH_SPICE);
fprintf("\tVOL = %.4g (V)\n", VOL_SPICE);
fprintf("\tVOH = %.4g (V)\n", VOH_SPICE);
figure(2)
plot(vin,dvout, 'linewidth',2);
set(gca, 'Fontsize',14);
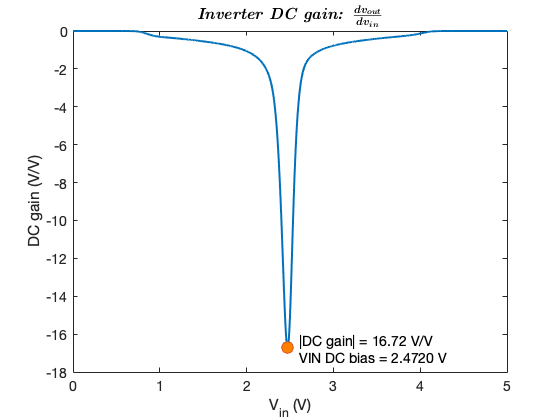
title('\textbf{\emph {Inverter DC gain:} \boldmath $dv_{out} \over dv_{in} $}',...
'interpreter', 'latex','Fontsize',16);
xlabel('V_{in} (V)');
ylabel('DC gain (V/V)')
xlim([0 5])
idx = find(dvout==min(dvout));
gain = abs(dvout(idx));
VIN = vin(idx);
VOUT = vout(idx);
fprintf("\nThe inverter max gain is %.4g (V/V)\n", gain);
fprintf("and it requires to bias the input node at: %.4g V DC\n",VIN);
str_gain = sprintf("|DC gain| = %.4g V/V", gain);
str_VIN = sprintf("VIN DC bias = %.4f V", VIN);
hold;
p = plot(vin(idx),dvout(idx),'-o','MarkerFaceColor',[1 0.5 0], ...
'MarkerSize',12);
text(2.6, -gain+0.4, str_gain, 'fontsize', 14)
text(2.6, -gain-0.5, str_VIN, 'fontsize', 14)
x = loadsig('./spiceout/C5_inverter_TRAN_ngsp_bin.raw');
lssig(x)
vin = evalsig(x, 'in');
vout = evalsig(x, 'out');
time = evalsig(x, 'TIME');
figure(3)
plot(time*1e9,vin, 'linewidth',2);
xlim([0 20]);
hold;
plot(time*1e9,vout, 'linewidth',2);
xlim([0 20]);
set(gca, 'Fontsize',14);
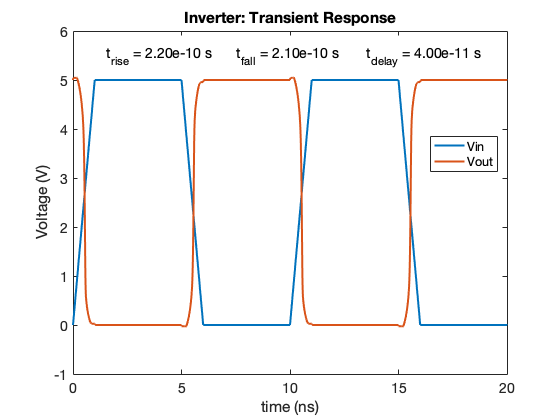
title('Inverter: Transient Response');
xlabel('time (ns)');
ylabel('Voltage (V)');
legend('Vin','Vout', 'location','best');
idx_3 = find(time*1e9 >= 3, 1, 'first');
idx_7 = find(time*1e9 >= 7, 1, 'first');
idx_12 = find(time*1e9 >= 12, 1, 'first');
vout_rise1 = vout(idx_3:idx_7);
vout_fall2 = vout(idx_7:idx_12);
idx_per10 = find(vout_rise1 >= 0.1*Vdd, 1, 'first');
idx_per90 = find(vout_rise1 >= 0.9*Vdd, 1, 'first');
t_rise = time(idx_3+idx_per90) - time(idx_3+idx_per10);
idx_per90 = find(vout_fall2 <= 0.9*Vdd, 1, 'first');
idx_per10 = find(vout_fall2 <= 0.1*Vdd, 1, 'first');
t_fall = time(idx_7+idx_per10)-time(idx_7+idx_per90);
vin_rise2 = vin(idx_7:idx_12);
idx_vin_per50 = find(vin_rise2 >= 0.5*Vdd, 1, 'first');
idx_vout_per50 = find(vout_fall2 <= 0.5*Vdd, 1, 'first');
t_delay = time(idx_7+idx_vout_per50)-time(idx_7+idx_vin_per50);
str_trise = sprintf("t_{rise} = %.2e s", t_rise);
str_tfall = sprintf("t_{fall} = %.2e s", t_fall);
str_tdelay = sprintf("t_{delay} = %.2e s", t_delay);
text(1.5, 5.5, str_trise, 'fontsize', 14)
text(7.5, 5.5, str_tfall, 'fontsize',14)
text(13.5, 5.5, str_tdelay, 'fontsize',14)
fprintf("\nTransient parameters extracted from the TRAN curve:\n")
fprintf("\tt_rise = %.2e (s)\n", t_rise);
fprintf("\tt_fall = %.2e (s)\n", t_fall);
fprintf("\tt_delay = %.2e (s)\n", t_delay);
trise_ngsp = evalsig(x, 't_rise');
trise_SPICE = trise_ngsp(1);
tfall_ngsp = evalsig(x, 't_fall');
tfall_SPICE = tfall_ngsp(1);
tdelay_ngsp = evalsig(x, 't_delay');
tdelay_SPICE = tdelay_ngsp(1);
fprintf("\nTransient parameters extracted directly from SPICE:\n")
fprintf("\tt_rise = %.2e (s)\n", trise_SPICE);
fprintf("\tt_fall = %.2e (s)\n", tfall_SPICE);
fprintf("\tt_delay = %.2e (s)\n", tdelay_SPICE);
print(figure(1), '-dpng', 'inverter_VTC_plot.png')
print(figure(2), '-dpng', 'inverter_gain_plot.png')
print(figure(3), '-dpng', 'inverter_TRAN_plot.png')
*********************************************************
               Hspice Toolbox for Matlab
 written by Michael Perrott (http://www-mtl.mit.edu/~perrott)
   while at Silicon Laboratories (http://www.silabs.com)
     Copyright (C) 1999 by Silicon Laboratories, Inc.
     This software is distributed under the terms of
       the GNU Public License (see the COPYING file
  for more details), and comes with no warranty or support
*********************************************************


ans =

  9×9 char array

    '1:VOLTAGE'
    '2:dvout  '
    '3:in     '
    '4:out    '
    '5:vih    '
    '6:vil    '
    '7:voh    '
    '8:vol    '
    '9:vsw    '

Current plot held
VTC parameters extracted from the VTC curve:
	VSW = 2.485 (V)
	VIL = 1.966 (V)
	VIH = 2.858 (V)
	VOL = 0.5603 (V)
	VOH = 4.404 (V)
VTC parameters extracted directly from SPICE:
	VSW = 2.459 (V)
	VIL = 1.966 (V)
	VIH = 2.858 (V)
	VOL = 0.5603 (V)
	VOH = 4.404 (V)

The inverter max gain is 16.72 (V/V)
and it requires to bias the input node at: 2.472 V DC
Current plot held

ans =

  6×9 char array

    '1:TIME   '
    '2:t_delay'
    '3:t_fall '
    '4:t_rise '
    '5:in     '
    '6:out    '

Current plot held

Transient parameters extracted from the TRAN curve:
	t_rise = 2.20e-10 (s)
	t_fall = 2.10e-10 (s)
	t_delay = 4.00e-11 (s)

Transient parameters extracted directly from SPICE:
	t_rise = 2.21e-10 (s)
	t_fall = 2.06e-10 (s)
	t_delay = 3.84e-11 (s)