Logic Analyzer
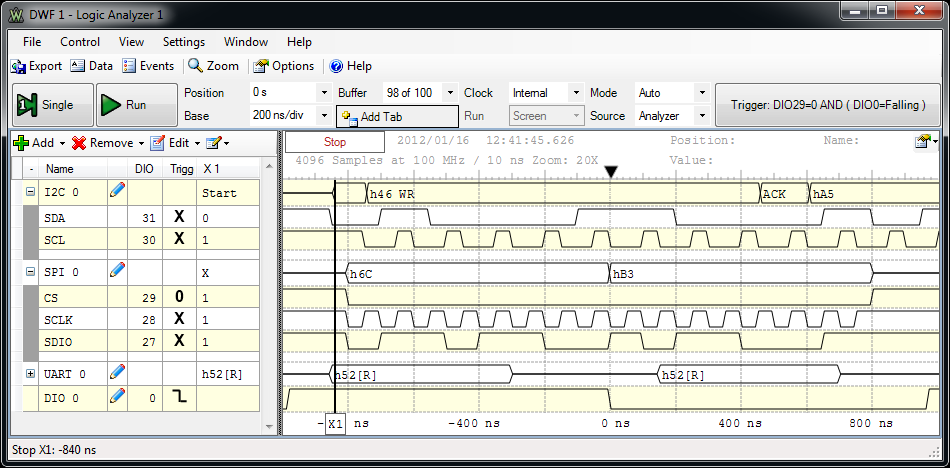
The Logic Analyzer (Analyzer) allows acquisition and visualization of digital inputs.
It is possible to configure the information being visualized: to choose which signals to visualize, to group signals in buses,
to configure protocol interpreters and to
visualize them in a specific order.
1. Menu Strip
1.1. File Menu
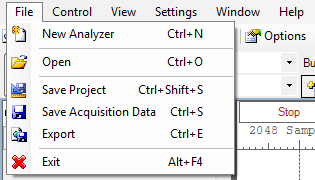
- New Analyzer: opens a new Analyzer window.
- Open: opens an Analyzer project or Analyzer Acquisition Data from file.
- Save Project: saves an Analyzer project to file.
- Save Acquisition Data: saves Analyzer Acquisition Data to file.
- Export: exports data or a screenshot from one of the opened views. See Export for more information.
- Exit: closes the Analyzer window.
1.2. Control Menu
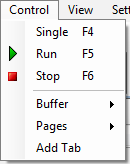
- Single: starts a single acquisition.
- Run: starts repeated or continuous acquisition.
- Stop: stops acquisition.
- Buffer: shows the next/previous buffer or clears buffers.
- Pages: navigates through tab pages or closes all the pages.
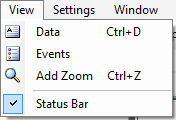
1.3. View Menu
1.4. Settings Menu
See Settings Menu.
1.5. Window Menu
See Window Menu.
1.6. Help Menu
See Help Menu.
2. Toolbar

3. Acquisition Bar

The acquisition bar contains the following:
- Single: starts a single acquisition.
- Run/Stop button: starts repeated or scan
acquisition, stops the acquisition. See Scan for details.
- Position: adjusts the horizontal trigger position.
The position units can be changed in Display
Options.
- Base: adjusts the time base. The time base units can
be changed in Display Options.
- Buffer: The performed acquisitions are stored in the PC buffer in time order. This makes it easy to review a series of repeated acquisitions. The new acquisitions are stored after the currently selected buffer position. If you change the position in the buffer and start a new acquisition, the positions after the selected one will be lost. The number of buffers can be specified in
General Options.
- Add Tab: saves the currently shown acquisition data
to a new tab. To close a tab, click the Close button at the upper right
corner of the plot area or click the tab with the middle mouse button.
The name of the tab and the description can be edited by double-clicking the tab header or by selecting the Edit Page Description menu
on the time view.
- Clock: select internal or external clock source for
Logic Analyzer (available on Electronics Explorer).
- Run: When the time base is greater than 100ms/div, the Run options select the action of the Run button
as follows:
- Repeated: the Run button starts repeated
acquisitions.
- Screen: scan acquisition where the sampled data
is drawn from left to right, when the right corner is reached, the
signal curve plot continues from the left.
- Shift: similar to the screen mode, but when the
signal plot reaches the right corner, the curve plot slides to left.
- Mode: The three trigger modes are:
-
Normal: the acquisition is triggered only on the specified
condition.
-
Auto: when the trigger condition does not appear in approximately
two seconds (configurable in Options), the acquisition is started automatically. In repeated acquisition mode, when the instrument switches to auto trigger, the next acquisitions are made without waiting again to timeout while a trigger event does not occur and the configuration is not changed. When a new trigger event occurs, or the configuration is changed, the current acquisition will be finished and the next one will wait for the trigger again. It is also the best mode to use if you are looking at many signals and do not want to bother setting the trigger each time.
-
None: the acquisition is started without a trigger.
- Source: select trigger source between Analyzer
trigger condition on pins, other device instrument, or external trigger
signals.
- Trigger: click to open the Trigger
Configuration
window.
3.1 Trigger Configuration
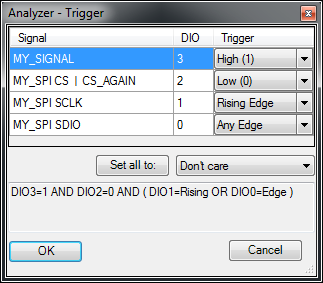
The overall trigger condition is built by AND-ing all level conditions together with the result of OR between edge conditions
of each pin. The following trigger conditions are possible for each pin:
 Don't Care: not
used in trigger condition.
 Low: low logic level.
 High: high logic level.
 Rising Edge: signal transition from low to high level.
 Falling Edge: signal transition from high to low level.
 Any Edge: any signal transition.
4. Signal Definition Grid

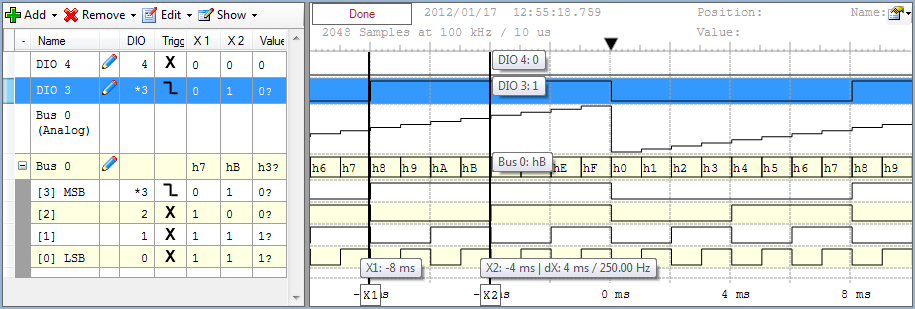
The Signals Definition Grid lets you customize the display of the signals that you are interested in.
See the operations on Lists.
4.1. Add

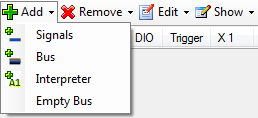
It is possible to add signals, define and add a bus or interpreter, create
an empty bus or
create a bus with the selected elements.
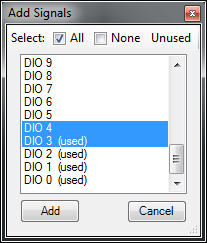
One or more signals can be selected and added at a time.

The Add Bus menu opens a bus property editor
and after configuring the bus will be
added to the grid.
4.2. Remove

It is possible to remove the selected items or clear the entire list.
4.3. Edit

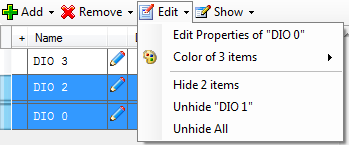
Under the Edit menu the following operation can be performed:
- Edit Property: Opens the properties editor for the last
selected item.
- Color: Opens the color dialog for background or
foreground and sets this color for the selected items.
- Hide: Hides selected items.
- Unhide: Unhides selected items.
- Unhide all: Unhides all the hidden items.
4.4. Show

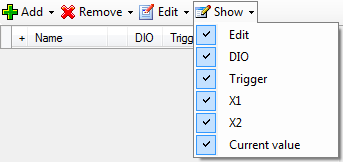
Under the Show menu, the visibility of optional grid columns can be selected. The grid
columns are as follows:
- Height: The row height can be changed in the first
column. When more rows are selected, and one of them is resized, the height
of all selected rows is changed.
- Expand/Collapse: Each bus can be individually
expanded or collapsed. Clicking on the column header expands or
collapses all the buses.
- Edit: Clicking on the edit icon of a signal, bus,
or interpreter row opens the editor.
- DIO: Shows the device digital IO pin number.
Multiple used signals are marked with star (ex: *3). The not-determined
signals are noted with ND.
- Trigger: Lets you configure the trigger condition
for the
Logic Analyzer pins. In this column, a left or right mouse-click opens a drop-down where the trigger condition can be selected. With
middle mouse click the trigger will be reset to Don't Care. When
multiple rows are selected, a right-click and middle-click sets the
trigger for all the selected pins. The trigger can be also selected with
shortcut keys: X - Don't Care, 0 - Low, 1 - High, R - Rising Edge, F -
Falling Edge, E - Any Edge. The trigger condition can also be selected
in Trigger Configuration.
- X #: Shows the value at the X1 and X2 cursor position.
The cursors appear in the waveform bottom
area.
- Current Value: Shows the current signal and bus
value even if the Analyzer acquisition is stopped. A question mark is
displayed after the value when this changed.
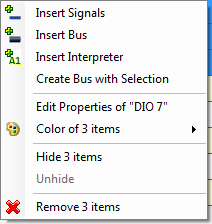
4.5. Context Menu

The grid context menu opens on mouse right-click. This contains similar buttons as the grid toolbar's Add, Remove and Edit menus.
The difference is that instead of signal, bus or interpreter addition insert will be performed
above the last selected row.
4.6. Waveform Area
The waveform area is divided in three sections: top, bottom, and center.
On the top and bottom area the time position can be adjusted by
horizontal left mouse button drag and the time base by right mouse button
drag.
4.6.1. Top Area

On the top of the waveform area the following information is shown:
- In the
top-left corner the
status label shows the state of the logic analyzer. See
Acquisition States for more
information.
- This is followed by the date and time of the current acquisition.
- The number of samples in the currently shown buffer and the acquisition
sample rate.
- On the right side, information about the mouse cursor position is
shown: the time, the corresponding row name, and value.
- In the top-right corner the plot context menu can be opened.
- The Close button appears when viewing saved or opened pages.
4.6.2. Bottom Area

On the bottom section the major time grids are displayed.
The X cursors
can be enabled under the Show menu. These can be moved with mouse horizontal drag. Dragging with left mouse button moves the cursor and
dragging with right button the cursor pair (X1 and X2) is moved
while the distance between them is preserved.
4.6.3. Center Area
This area is used to display rows containing the graphical visualization of waveforms.

From the context menu of the waveform area,
PushPins can be added or removed.

The HotTrack allows you to take measurements by moving the mouse cursor.
This is represented by a vertical cursor and the values at intersection with individual
signals, buses, and interpreter are shown. When the mouse cursor is inside a pulse, the
vertical cursor will be placed at the start of the pulse and shows the pulse
width. If a period of a signal is detected in the right direction, it will show the period length
expressed in time and frequency, and the duty.
5. Property Editor
The property editor can be opened for the selected signal, bus or
interpreter under the
grid toolbar edit menu, under the context menu or by mouse middle click on
the row.
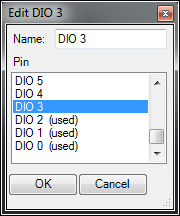
5.1. Signal

In the signal property editor, the name can be specified and the
device pin changed.
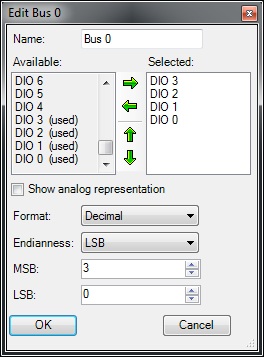
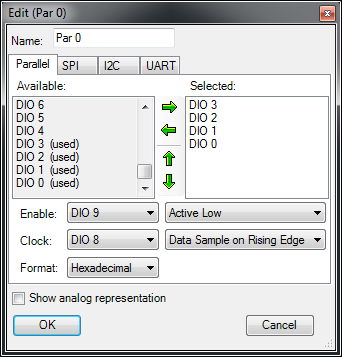
5.2. Bus

In the bus property editor, the following can be configured:
- Name: edit the displayed name of the bus.
- Available: shows the available signals.
- Selected: shows the selected bus signals. The
signals can be added or removed with the left-right arrow-buttons or
mouse drag and drop. The order of the bus signals can be changed with
up/down arrow-buttons or with mouse drag and drop.
- Show analog representation: displays the analog representation of the bus values.
- Format: selects the values format of the bus.
- Binary values are displayed with "b" leading
character.
- Decimal
- Hexadecimal values are displayed with "h" leading
character.
- Vector values are displayed with "v" leading
character. Vector value is the raw binary value without index.
- Endianness: selects between little and big endian,
least significant bit (LSB), first or most significant bit (MSB) first.
- LSB/MSB: selects the values for first and last
indices, LSB and MSB. The index values can be set so that the index
remains within the -32 and +31 range.
5.3. Interpreter
5.3.1. Parallel

The parallel interpreter lets you define a bus with optional enable and
clock signals.
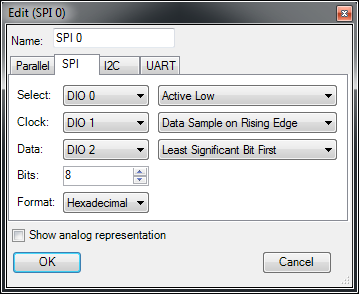
5.3.2. SPI

SPI interpreter lets you define a synchronous serial data link with the following options:
- Select: slave or chip select signal with low or high active level.
- Clock: is the serial clock with data sampling on rising or falling edge.
- Data: is the serial data signal (MOSI or MISO) with least or most significant bit first shifting.
- Bits: the number of data bits in a transmission word.
- Format: allows selecting the display mode of the value in binary, decimal or hexadecimal formats.
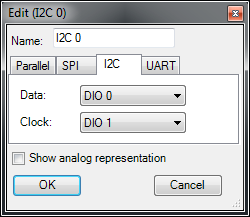
5.3.3. I2C

For I2C or Two Wire Interface interpreter, the clock and data signals can be selected.
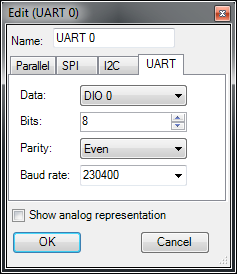
5.3.4. UART

The UART interpreter for asynchronous serial protocols lets you
select:
- Data: the data signal.
- Bits: the number of data bits in a transmission word.
- Parity: selects between Odd, Even, Mark (High), and Space (Low) parity modes.
- Baud rate: allows specifying the speed or bits per second of the line.
6. Views
6.1. Data View
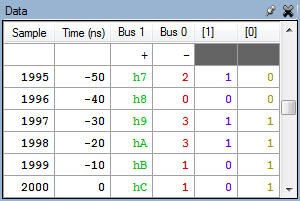
The Data View displays the data samples.

The first column shows the sample index and the second columns shows the
sample time relative to the trigger position.
6.2. Events View
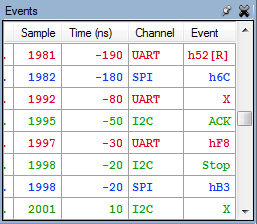
The Events View displays the digital data changes and the time stamps.

The first column shows the sample index, the second shows the time stamp followed by the events for channels.
The visible events on the waveforms plot are marked with bold. When making a new acquisition or changing the time base or position, the list is scrolled so the first row is the first visible sample. For Events in zoom view, changing the selection parameters will also scroll the list.
The selected cells can be copied and pasted to other applications (like Microsoft® Excel™ ).
6.3. Zoom View
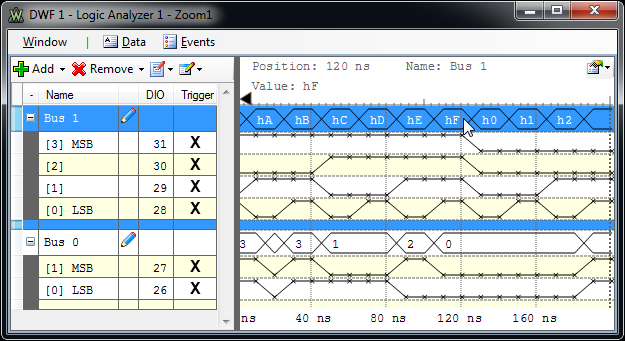
The Zoom views are useful in analyzing a portion of the main view and comparing these segments. In a Zoom window
data and events views can be opened.

The selected segment is represented in the main time plot by an opaque rectangle. The currently active selection
is less opaque than the others.
The selection can be resized by dragging the selection corners and moved by dragging the rectangle area or by left/right mouse button-dragging in the Zoom
time view's top and bottom area. The selection can also be resized by mouse
control + scroll with active selection or Zoom window.
You can move the selection using the keyboard arrow keys. When you hold the Shift key, the selection is resized. When you hold the Ctrl key, moving or resizing is faster.
7. Export
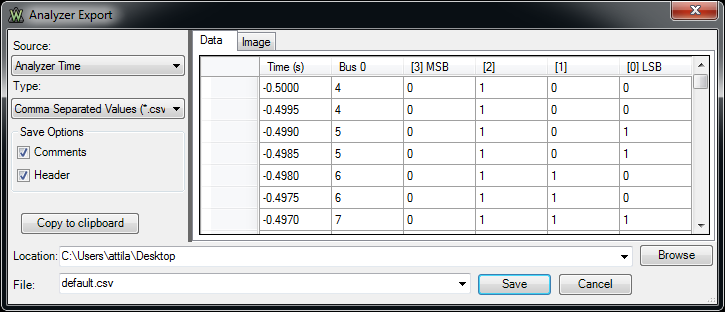
The Export dialog lets you save the data or a screenshot from the main time view or other views. The data can be saved as CSV (Comma Separated Values) or TXT (Tab Delimited Values).
By checking the save options, the following information will be also saved:
- Comments: title, device name, serial number and software
version
- Header: column header names
The screenshot image can be saved in
BMP (Bitmap), PNG (Portable Network Graphics), GIF (Graphics Interchange
Format), TIFF (Tagged Image File Format), JPEG (Joint Photographic Experts
Group) or EPS (Encapsulated PostScript) formats.

8. Options
Options written in bold characters have been modified from the default settings.
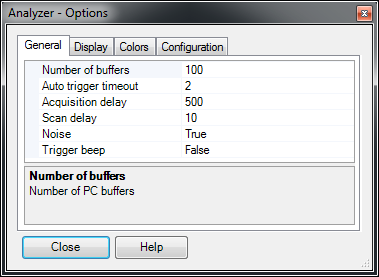
16.1. General Options

- Number of PC buffers: to store the previous acquisitions.
- Auto trigger timeout: expressed in seconds. This specifies the time after the oscilloscope will enter in no trigger mode when the selected trigger condition or source is not activated.
- Acquisition delay: expressed in milliseconds. This specifies the time period at which the application will check the oscilloscope device status and read the acquired data
in repeated mode.
- Scan delay: expressed in milliseconds. This specifies the time period at which the application will check the oscilloscope device status and read the acquired data
in scan screen or shift mode.
- Noise: use half of the buffer for storing noise, more than
one transition between two samples.
- Trigger beep: enable PC beep on triggered acquisition.
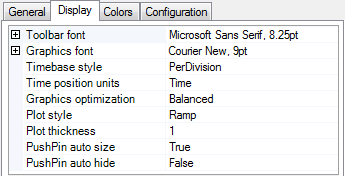
16.2. Display Options

- Toolbar font: selects font and size for the toolbar.
- Graphics font: selects font and size for other text.
- Time base style: selects the display mode for time base (per division, plus-minus, and full).
- Time position units: selects the unit of the time position parameter (time or division).
- Graphics optimization: adjusts the balance between quality and speed.
- Plot style: selects the method of transition representation. Available options include:
- Vertical line on signal transition.
- Ramp between signal samples.
- Plot thickness: sets the thickness of the sample plot, expressed as points.
- Plot thickness: sets the thickness of the grid lines, expressed as points.
- PushPin auto size: selects the default auto size option for pushpins.
- PushPin auto hide: selects the default auto hide option for pushpins.
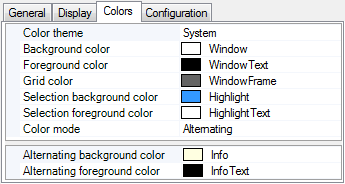
16.3.
Colors Options

The Colors tab lets you select the color options for background,
foreground, grid, selection background, and selection foreground.
Three color modes are supported:
- Uniform: In this mode, all the rows have the same
background and foreground color.
- Alternating: In this mode, the rows have alternating
background and/or foreground color. The alternating color can be
configured below.
- Unique: This mode lets you specify unique
background and/or foreground color for each bus and signal.
Changing the Color Theme loads a default set of colors.
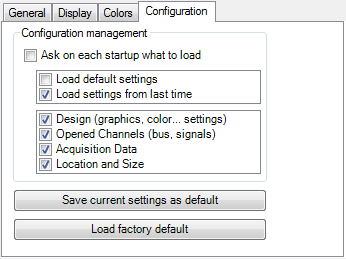
16.4 Configuration Options

Ask on each startup what to load: lets you select whether the default or last configuration is loaded at start-up, as well as which
items to configure.
Save current settings as default: saves the settings you have selected.
Load factory default: restores the factory default settings.


 Don't Care: not
used in trigger condition.
 Low: low logic level.
 High: high logic level.
 Rising Edge: signal transition from low to high level.
 Falling Edge: signal transition from high to low level.
 Any Edge: any signal transition.