Power Supplies and Voltmeters - Electronics Explorer
This instrument has two main areas, the control area and the plot window.
The control area contains voltmeters and power supplies with adjustable voltage and current.
The plot window lets you create one or more signal plots, each in its own window.
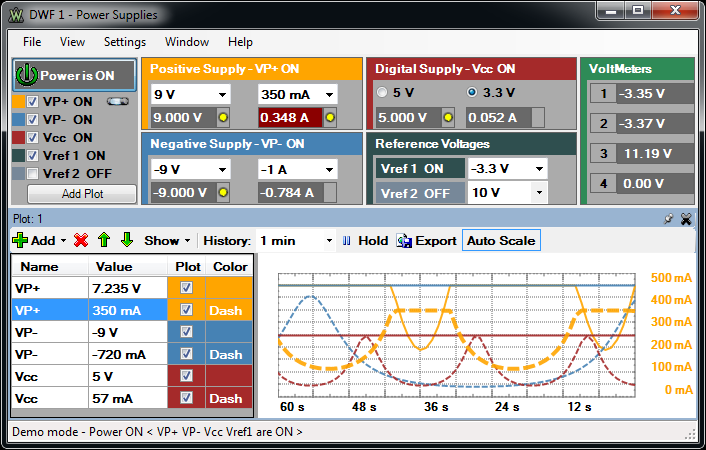
1. Control Area
The control area lets you adjust the settings for the various voltmeters and power supplies.
- Power: is the master ON/OFF switch for the power supplies and reference voltages.
- On/Off: are enable switches for each supply.
- Voltage and current fields: let you adjust values for the power supplies by either selecting a value from combo box, typing it, or using the
slider.
- Radio buttons: let you select 3.3V or 5V output for the fixed power supply.
- Add Plot button: opens an empty plot window.
2. Plot Window
You can create one or more plot windows by clicking the Add Plot button in the control area.
Each of these docking windows has the following components:
- Add: opens a drop-down list. Select an item from the list and press the Add button (or double click) to add it to the plot list.
- Delete: removes the selected item(s) from the list
- Up/Down: move the selected item(s) up/down in the list.
- Show/Min/Max: adds columns displaying the minimum and maximum levels from the history plot.
- History: specifies the time span for the plot.
- Hold: enables or disables the readings for the respective plot window.
- Export: saves history samples or picture. See
Plot Export.
- Auto Scale: enables auto-scaling based on the extremes from the plot history. The scaling value appears in a new Scale column.
3. Export
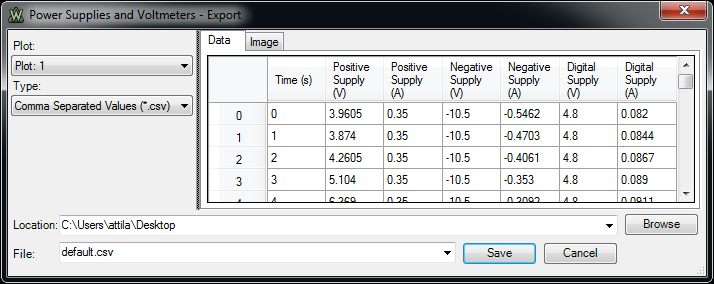
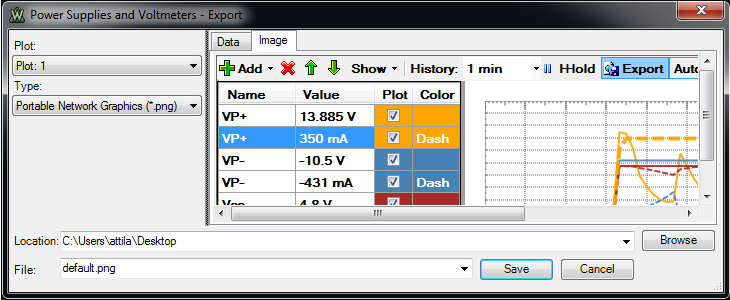
You can save acquisition data by clicking Save in the plot window.
The data can be saved in comma-separated or tab-delimited value formats. The plot window image can be saved in .bmp or .png format.
4.
Options
From the Settings menu, choose Options.
4.1. General Options
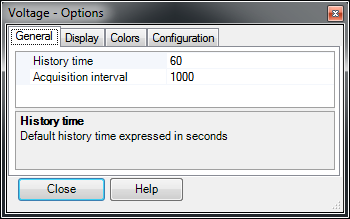
-
History Time: specifies the default history time that will be used for new plot windows
-
Acquisition Interval: configures the acquisition interval specified in milliseconds. Shorter intervals than the default settings may produce jumpy
readings.
4.2. Display Options
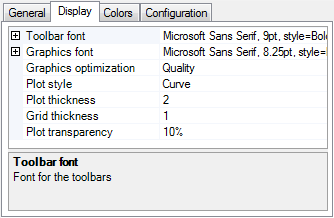
- Graphics Font: selects font and size.
- Toolbar Font: selects font and size.
- Graphics Optimization: adjusts the balance between quality and speed.
- Plot Style: selects the method of sample representation. Options include:
- Curve: between sample points.
- Curve: between sample points.
- Dots: to display the sample points.
- Plot Thickness: sets the thickness of the drawn samples.
- Grid Thickness: sets the thickness of the grid
lines.
- Plot Transparency: selects the transparency of the sample plot.
4.3. Colors Options
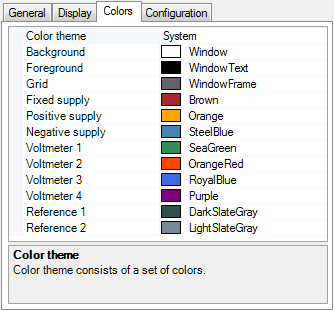
The Colors tab lets you select the color options for: background,
foreground, grid, and channels.
Changing the Color Theme loads a default set of colors.
4.4. Configuration Options
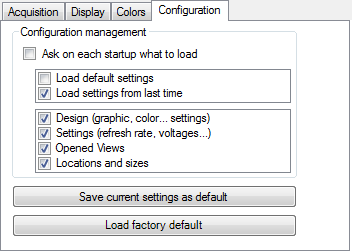
Ask on each startup what to load: lets you select whether the default or last configuration is loaded at start-up, as well as which items
to configure.
Save current settings as default: saves the settings you have selected as default.
Load factory default: restores the default settings.