GENERAL CHEMISTRY TOPICS
Chemical kinetics
Reaction rates: definitions and relation to reaction stoichiometry. Rate laws and rate constants. Reaction order: Individual and overall orders. Determining reaction orders using experimental initial rate measurements. Reaction rates at the nanoscale and the collision model. Reaction coordinate diagrams and the dependence of rates on temperature and activation energy. Catalysis.
Summary
The rates of chemical reaction vary widely. An explosion can result from an extremely rapid chemical reaction. The slowness of other chemical processes - the yellowing of newspaper, for example - is apparent. As chemists, we would like to understand what makes one reaction fast and another slow, and discover ways in which to control reaction rates. First, we will need to work out a definition for reaction rate that we can use as the basis for a quantitative approach to chemical kinetics. Our account of the factors that influence rate of a reaction, as well as the relationship between reaction rate and chemical equilibrium, can then be expressed quantitatively. rate constant for a reaction (as part of its Once we arrive at a clear general definition for reaction rate we will move on to define the rate constant for a reaction (as part of its rate law), and see how it is measured for particular reactions.
To begin our study of chemical kinetics, we make sure we clearly answer the question, "What is a reaction rate?" In doing so, we will distinguish between average rates and instantaneous rates, and emphasize the idea that the rate we are usually most interested in is the initial rate, that is, the instantaneous rate at the very start of the reaction.
At the very start of a reaction, when there are no products present, only the forward reaction contributes to the observed rate of reaction. As products begin to accumulate, the observed rate begins to drop due to the fact that a reverse reaction can begin to take place. Thus, in contrast to the initial rate of reaction, as the reaction progresses the observed net rate trends toward zero, and a state of dynamic equilibrium is attained. "Dynamic" refers to the nanoscale view at which chemical transformations continue, yet the rates of forward and reverse reactions are equal, and no net rate of reaction is observed at the macroscale. These ideas are discussed at greater length and depth in the kinetics and equilibrium web page.
In defining reaction rates, we'll need to consider the reaction stoichiometry. This will lead us to a consistent definition regardless of stoichiometry. This definition will allow us to write equivalent expressions for reaction rate based upon a generalized chemical reaction.
The factors that affect reaction rates are (1) the nature of the reactants, (2) the concentrations of reactants (3) the temperature at which the reaction occurs, and (4) the presence of a catalyst.
Defining reaction rates
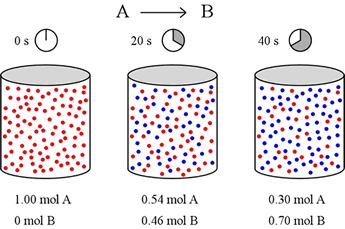
Let's imagine a simple reaction taking place in the gas phase in a 1 L container. Molecules of A (red) can spontaneously convert to molecules of B (blue). We want to know how fast this occurs, so we set up our container with 1 mol of pure A, and start the clock. Twenty seconds later, we obtain a snapshot that shows how much of both A and B are present, and again at 40 s after starting the reaction.

Let us define reaction rate in terms of a ratio of the change in concentration of a reactant or product (Δ[A] or Δ[B]) over change in time (Δt). For this example, over the first 20 seconds, mol A drops from 1.00 mol to 0.54 mol. Thus
Δ[A] = [A]final – [A]initial = (0.54 – 1.00) M = – 0.46 M
The rate of change the concentration of A over this time period is
Δ[A]/Δt = (– 0.46 M) / 20 s = –2.3 × 10⁻² M s–1
Similarly, the concentration of B rises from 0 mol to 0.46 mol over the first 20 seconds, and the rate of change of [B] is equal in magnitude to that for [A] over this time period, but positive in sign.
Δ[B] = [B]final – [B]initial = (0.46 – 0.00) M = + 0.46 M
Δ[B]/Δt = (0.46 M) / 20 s = 2.3 x 10⁻² M s–1
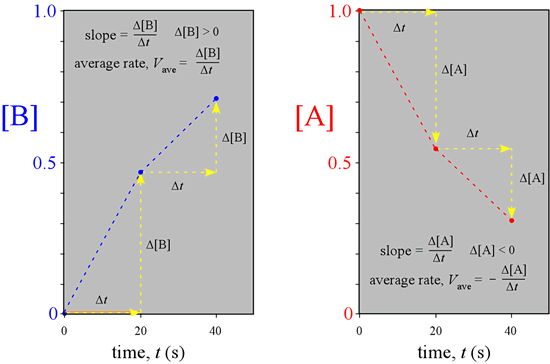
The relationship Δ[B]/Δt = – Δ[A]/Δt must hold for every time period we choose to look at, as we should realize from the stoichiometry of the reaction. Thus we can think of reaction rate as either a rate of disappearance of reactant, or the rate at which product appears.
For the second 20 seconds, the average rate computes to
– Δ[A]/Δt = Δ[B]/Δt = (0.70 – 0.46)M / 20 s = 1.2 x 10⁻² M s–1
The reaction slows over the next 20 seconds, and in general the rates we observe are maximal at the start of a reaction, and decrease as the reaction progresses. Why is this? There are two possible reasons, and both are important. Starting with just A, the concentration of A drops as the reaction progresses. There is less A to convert to B in the forward reaction (A → B) as time elapses. The rate we observe depends on the concentration of A at the time we observe the reaction. The other reason is the rates we actually observe are net rates. It is important to recognize that any reaction is reversible (although in many cases one direction is greatly favored, making the reaction irreversible in practical terms). Initially, there are no products present, so no reverse reaction (B → A) can occur. As the reaction progresses, the increasing amounts of product will lead to increasing rate of the reverse reaction, which can significantly affect the observed (net) reaction rate. Let's summarize these key points:
- forward rate decreases as reactant concentration decreases
- net rate = forward rate – reverse rate
- reverse rate increases as product concentration increases
A graphical representation of the reaction illustrated above, made by plotting the concentrations versus time for the three time points, makes clear that the rates we just calculated are obtainable as the slopes of the lines connecting the points on the graph.

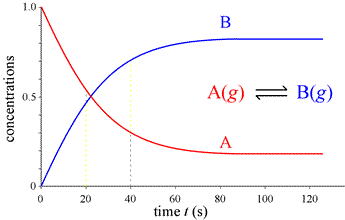
What would we observe if we could continuously monitor the amounts of A and B instead of a few snapshots, and follow the course of the reaction indefinitely, until no further change is detectable and the system is at equilibrium?

This complete course of a reaction, from the start (reactants only present) until equilibrium is reached (unchanging amounts of reactants and products), is illustrated by the graph at left, called a progress curve for the reaction. If we are able to determine amounts of reactants and products at many closely spaced points in time, our concentration vs. time graph approaches a smooth curve. Furthermore, the reaction rate at any point in time is now obtainable as the slope of the tangent to the curve(s) at that time. Note the reaction rate goes to zero (slope = 0) at times greater than about 80 s.
We will call the reaction rate obtained in this way the instantaneous rate, V, while the reaction rates we obtained above over time intervals are examples of an average rate, Vave. If you are familiar with calculus, you know that the slope of the tangent to a curve is obtained as the derivative of the function describing the curve.
What we really want to be able to do is to determine - as accurately as possible - an initial, instantaneous rate. we'll call this V0. The use of an initial rate eliminates any possible contribution of the reverse reaction to the observed rate, so that the observed rate is the forward reaction rate. This definition for V0 will lead to a quantitative relationship between it and the initial concentrations of reactants, which will be the rate law.
General form of the definition of reaction rate
Consider the reaction
2 HI(g) ⇌ H2(g) + I2(g)
In this example, Δ[HI]/Δt must be twice as large as –Δ[H2]/Δt or –Δ[I2]/Δt. Again, this must be true because of the stoichiometry of the reaction. For every molecule of that H2 that appears, one molecule of I2 also appears, while two molecules of HI must disappear. We can generalize this by giving the expressions for equivalent rate quantities for the general reaction aA + bB → cC + dD:
Vave= – (1/a)(Δ[A]/Δt) = – (1/b)(Δ[B]/Δt) = (1/c)(Δ[C]/Δt) = (1/d)(Δ[D]/Δt)
for some finite interval Δt. For instantaneous rates,
V = – (1/a)(d[A]/dt) = – (1/b)(d[B]/dt) = (1/c)(d[C]/dt) = (1/d)(d[D]/dt)
where d[A]/dt, . . ., d[D]/dt represent the derivatives of [A],..,[D] with respect to time, t. As concentration varies with time, the value of the derivative of a concentration function at a given time gives the slope of the concentration vs. time curve at that time. Note, with respect to the typical progress curve, the slope of the tangent to the curves is steepest at time t = 0, and the slopes decrease in magnitude until the curves become flat (slope = 0), and the reaction has reached equilibrium. The dependence of instantaneous rate at time t = 0, the initial instantaneous rate, V0, on initial concentration of reactant will lead us to the formulation of rate laws for reactions.
Example problem: (a) Write all equivalent expressions for the average and instantaneous initial reaction rates for the following reaction:
2 N2O5(g) = 4 NO2(g) + O2(g)
(b) What is the relation between the rate expressions written for (a), and those for the following reaction?
N2O5(g) = 2 NO2(g) + ½O2(g)
Reaction coordinate diagrams
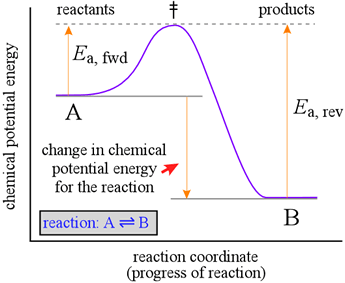
To help us understand the reason why an energetically favorable reaction (i.e. products are favored, and Keq large) may nonetheless take place at only a very slow rate, we introduce a representation of a reaction called a reaction coordinate diagram. Such diagrams are used frequently in chemistry, being useful in illustrating many features of chemical reactions. Here we look at a hypothetical reaction coordinate diagram for the simple reaction A = B, which will help illuminate the relationship between chemical kinetics and chemical equilibrium.

The diagram at right shows a graph (purple line) of chemical potential energy (vertical axis) versus a "reaction coordinate" (horizontal axis), which is meant to represent the progress of bond breaking and reformation that occurs in a typical chemical reaction. Let us imagine that in this reaction, one bond must break and a new bond forms. Our observations of processes occurring in nature indicate that they generally proceed spontaneously in the direction in which a minimum of potential energy is reached. Suspended objects fall to the ground when released, batteries run down, and even stars eventually burn out and die. We know that a mixture of hydrogen and oxygen gases is potentially explosive, yet at room temperature, no observable reaction takes place.
The reaction coordinate diagram suggests an explanation. In order for the reaction to take place, the reactant molecules have to possess enough energy to reach an unstable configuration called the transition state (symbolized by the double dagger, ‡) before they can "fall" to the potential energy minimum of conversion to B. We can think of this activation energy, Ea, for the forward reaction, as the energetic cost required to advance the bond breaking in A to the point where formation of the new bond in B can begin to provide an energetic payback.
A key point to note is that the change in chemical potential energy is related to the equilibrium constant for the reaction, whereas the magnitude of the activation energy is related to the rate of the reaction. The greater the loss in chemical potential energy in going from A to B, the larger the equilibrium constant. However, the greater the activation energy, the slower the rate of conversion of A to B will be. An inspection of the Maxwell-Boltzmann distribution of molecular energies, which can tell us how many molecules of A at given temperature will have an energy of Ea or greater, and thus the fraction of A molecules capable of reacting. The greater the value of Ea, the fewer molecules of A will have the energy to react. This helps us understand why a mixture of hydrogen and oxygen can sit peacefully at room temperature, with no detectable production of water. The activation energy for the reaction is so high that only an infinitesimal number of molecules have the energy to possibly react. However, if a spark is provided, the molecules in the immediate vicinity acquire more energy, and a sufficient number of them react, which in turn releases much more energy (the reaction is strongly exothermic). A runaway process of reacting molecules and energy release is initiated, and an explosion immediately ensues.
The latter fact implies that the reverse reaction, conversion of B to A, will be much slower than the forward reaction when the concentrations of A and B are equal, since Ea, for the reverse reaction is much greater than that for the forward reaction. In order for this reaction to reach equilibrium, the concentration of B will have to increase well beyond that of A in order to fulfill the equilibrium condition that the rates of the forward and reverse reactions are equal.