| DC coupling | AC coupling |
|---|---|
|
|
An oscilloscope (or "scope") lets you view signal voltages, typically in a two-dimensional graph where one or more electrical potential differences (on the vertical axis) are plotted as a function of time or of some other voltage (on the horizontal axis).
Most of the time, oscilloscopes are used to show events that repeat with either no change or change slowly.
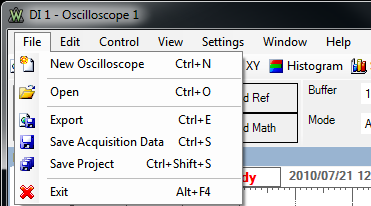

The Copy as Text and Image operations refer to the active view. The active view name is shown under the Settings menu.
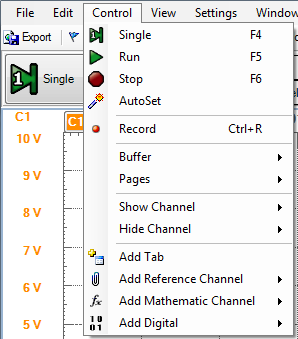
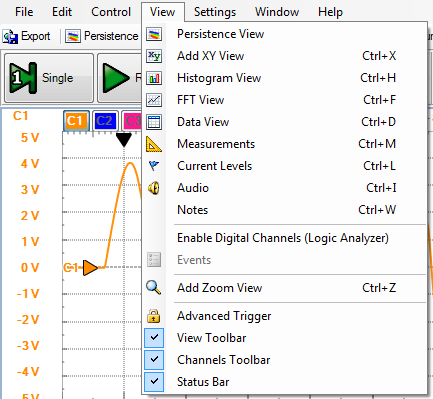
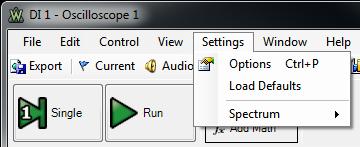
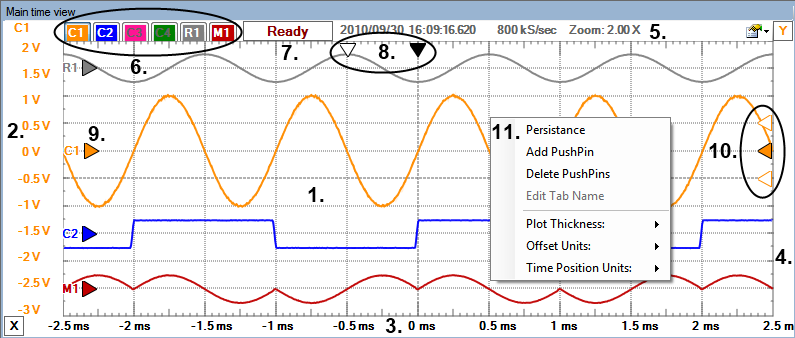
The context menu is shown for the active view. It contains options available for the view.

You can open different views of the signals on the main time plot.
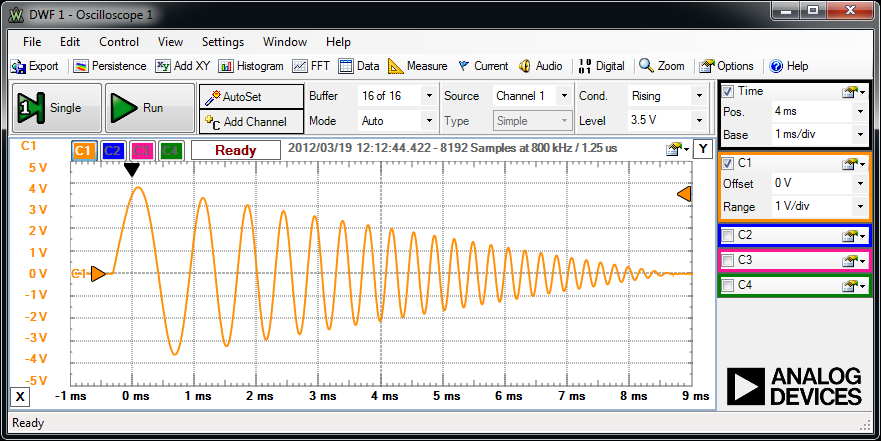
This toolbar contains the time and channel configuration groups. The configurations for the opened reference and math channels are added to this toolbar.
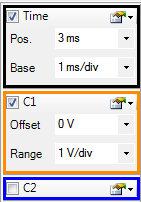
The check-box before the name enables or disables the respective channel. The properties drop-down button in the top-right corner lets you configure the channel properties. The mathematic and reference channels also have a close button.

Use the time group to position and scale the waveform horizontally using the time base and the horizontal trigger position controls. You can set the background, text, and axis color in the group properties.
The time base (seconds/division) setting from the channel configuration toolbar lets you select the rate at which the waveform is drawn across the screen. This setting is a scale factor.
For example, if the setting is 1 ms, each horizontal division represents 1 ms and the total screen width represents 10 ms (ten divisions). Changing the sec/div setting lets you visualize longer or shorter time intervals of the input signal.
The horizontal position control moves the waveform left or right to exactly where you want it on the screen.
It actually represents the horizontal position of the trigger in the waveform recording. Varying the horizontal trigger position allows you to capture what a signal did before a trigger event (so-called
"pre-trigger viewing").
Digital oscilloscopes can provide pre-trigger viewing because they constantly process the input signal whether a trigger has been received or not.
Pre-trigger viewing is a valuable troubleshooting aid. For example, if a problem occurs intermittently, you can trigger on the problem, record the events that led up to it, and possibly find the cause.

Use the real channel (vertical controls) to position and scale the waveforms vertically using the offset and range controls for each channel.
In the property drop-down, the following can be configured:The offset (vertical position) control lets you move the waveform up or down to exactly where you want it on the screen. The offset is the voltage difference between the centerline of the oscilloscope screen and the actual ground. This difference is generated by an internal offset voltage source.
The range (volts/division) controls determine the vertical scale of the graph drawn on the oscilloscope screen.
The volts/div setting is a scale factor. For example, if the volts/div setting is 2 volts, then each of the ten vertical divisions represents 2 volts and the entire screen can show 20 volts from bottom to top. If the setting is 0.5 volts/div, the screen can display 5 volts from bottom to top, and so on. The maximum voltage you can display on the screen is the volts/div setting multiplied by the number of vertical divisions.
Coupling is the method used to connect an electrical signal from one circuit to another. In this case, the input coupling is the connection from your test circuit to the oscilloscope.
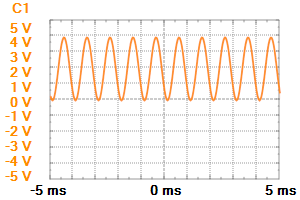
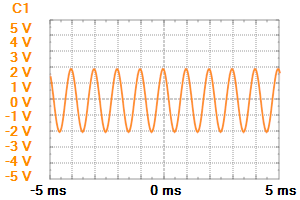
On the Electronics Explorer board, the input coupling AC and DC are separate input connectors on the board with AC and DC marks. DC coupling shows all of an input signal. AC coupling blocks the DC component of a signal so that you see the waveform centered at zero volts.
The following diagram illustrates this difference. The AC coupling setting is handy when the entire signal (alternating plus continuous components) is too large for the volts/div setting.
| DC coupling | AC coupling |
|---|---|

|

|
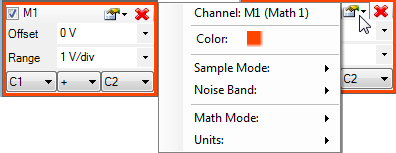
The integrated mathematic functions let you perform a variety of mathematical calculations on the input signals of the oscilloscope. The Add Math button creates a new mathematic channel that can be configured to add, subtract, or multiply two channels. The mathematic operations are performed by the PC, so the oscilloscope device can not trigger on these channels. The units for the math channel can be specified, for instance: A, W
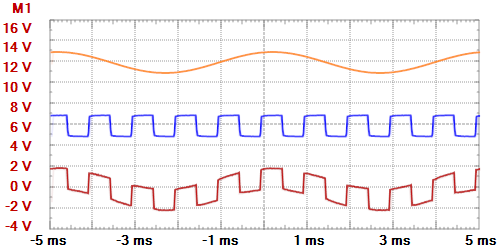
The custom or simple mathematic channel can be selected under the channel properties as shown below.

The Custom Math Function editor can be launched with the bottommost button showing the formula.
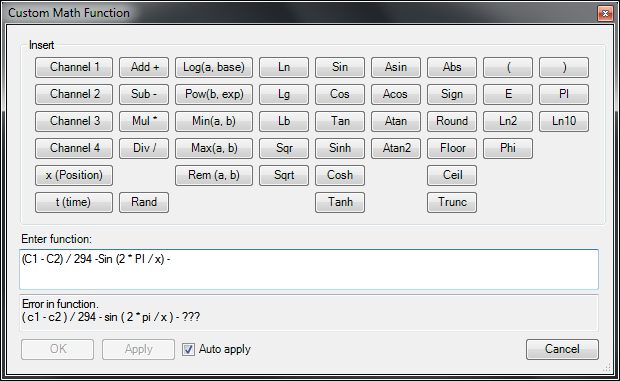
You can type the custom function in the Enter Function text box. The processed formula is displayed below it. If the typed function does not make any logical or mathematical sense, "Error in function" is displayed.
Click Apply to enter changes. Check the Auto apply checkbox to automatically use function modifications.
Click OK to save the last valid function.
Click Cancel to use the function saved before the editor was opened.
Accepted values are:
The reference channels can be added with the Add Reference Channel button from the acquisition toolbar.
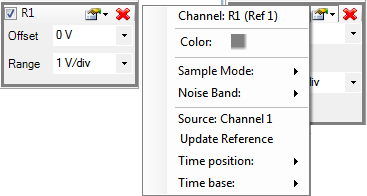

The performed acquisitions are stored in the PC buffer in time order. This makes it easy to review a series of repeated acquisitions. The new acquisitions are stored after the currently selected buffer position.
If you change the position in the buffer and start a new acquisition, the positions after the selected one will be lost. The number of buffers can be specified in Options general tab.
See Triggers for more information.
The scan modes (Screen and Shift) are available when the time-base is greater than 100 milliseconds/division. Below this value, the repeated mode is used for the Run button.
The trigger controls let you stabilize repeating waveforms and capture single-shot waveforms.

The trigger source selects the oscilloscope channel that is used for the trigger. Other instruments or external trigger signals can be used to trigger the oscilloscope.
The trigger type selects between simple, edge, pulse, and transition.
Edge triggering is the basic and most common type. For edge triggering, the trigger level and slope controls provide the basic trigger point definition. The trigger circuit acts as a comparator. You select the slope and voltage level of one side of the comparator. When the trigger signal matches your settings, the oscilloscope generates a trigger.
The slope-condition control determines whether the trigger point is on the rising or the falling edge of a signal.
A rising edge is a positive slope and a falling edge is a negative slope.
The level control determines where the trigger point occurs on the edge. The following figure shows you how the trigger slope and level settings determine the waveform display.
| Triggering on rising edge | Triggering on falling edge |
|---|---|
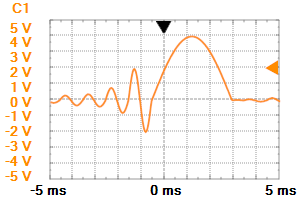
|
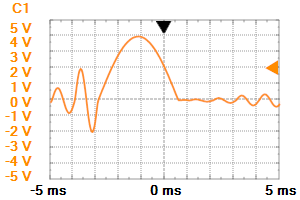
|
If the trigger type is set to Pulse, then the oscilloscope will trigger if a positive/negative pulse has a larger/smaller length than the one already set by the user. For example, if the pulse is smaller than the length set, and the triggering condition is set to more, the oscilloscope will not trigger.
The picture below shows a positive pulse trigger configured for less than 200 us.

The picture below shows a positive pulse trigger configured for time-out at 200 us.

The picture below shows a positive pulse trigger configured for more than 200 us.

The transition trigger is similar to the pulse trigger, but here the transition time of a signal is compared with the specified length. The low and high transition levels are specified by the hysteresis window.
The picture below shows a rising transitions trigger from -3V to +3V configured for less than 200 us.

The picture below shows a rising transitions trigger from -3V to +3V configured for time-out at 200 us.

The picture below shows a rising transitions trigger from -3V to +3V configured for more than 200 us.

The trigger sample selects the sample mode that will be used by the trigger detector. This can be different from the one used for acquisition, which is why the trigger event might be not visible on the acquired data.
The trigger condition for edge and transition type selects between rising or falling edge. For pulse trigger it selects between positive or negative pulse.
The trigger level is the adjustable voltage level at which the scope triggers when the trigger input crosses this value. See Trigger Hysteresis and Trigger Types.
Using hysteresis, low and high levels are determined (the trigger level plus and minus the hysteresis value). When the signal level exceeds the high level, it is considered as high and it stays high until falling below the low level. This is used to avoid bouncing caused by signal noise and also to specify the transition trigger conditions.

The picture below shows how, without hysteresis, the trigger event also occurs on the falling edge of the input signal, due to signal noise.

The trigger length condition selects between less, time out or more for pulse length or transition time. See Pulse Trigger and Transition Trigger.
The trigger length specifies the minimal or maximal pulse length or transition time. See Pulse Trigger and Transition Trigger.
The trigger holdoff is an adjustable period of time during which the oscilloscope will not trigger. This feature is useful when you are triggering on complex waveform shapes, so the oscilloscope triggers only on the first eligible trigger point.
The following figure shows how the trigger holdoff helps to create a usable display.

Trigger with 10ms holdoff

Trigger without holdoff
The holdoff length should be around the maximum burst length, preferably a little bit more, but not less than this. For the above situation, the holdoff value should be around 6ms, but lengths between 6 and 15 ms are also acceptable.
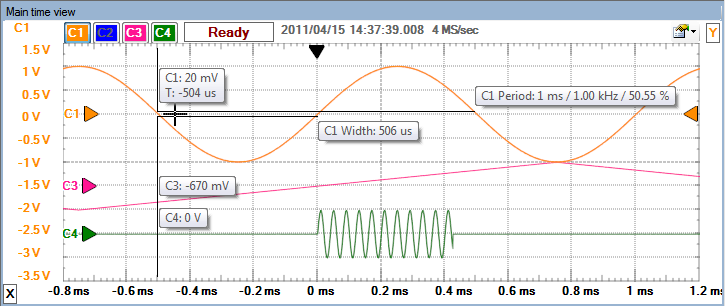
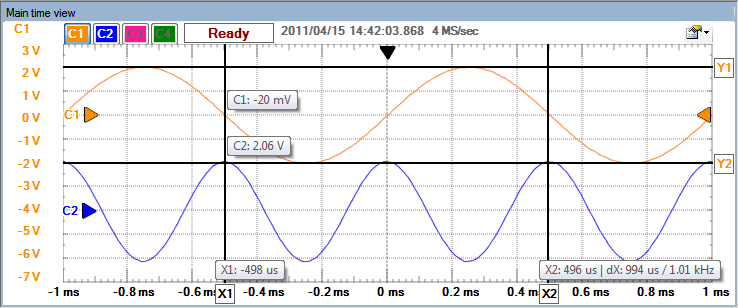
The HotTrack lets you take measurements by moving the mouse cursor. When the mouse cursor position is close to a waveform slope, it will place a vertical cursor and two more towards left, measuring the pulse width and period. Otherwise, it will place one vertical cursor showing the time position and the waveform's level at the intersections with the vertical cursor.
The X and Y cursors are available for main time view and zoom time plots. These can be moved with mouse horizontal or vertical drag. Dragging with left
mouse button moves the cursor and with right button the pair of cursors (X1 and X2 or Y1
and Y2) is moved keeping the distance between them.
The X or vertical
cursors by default are in the bottom-left and the Y cursors in top-right corner.
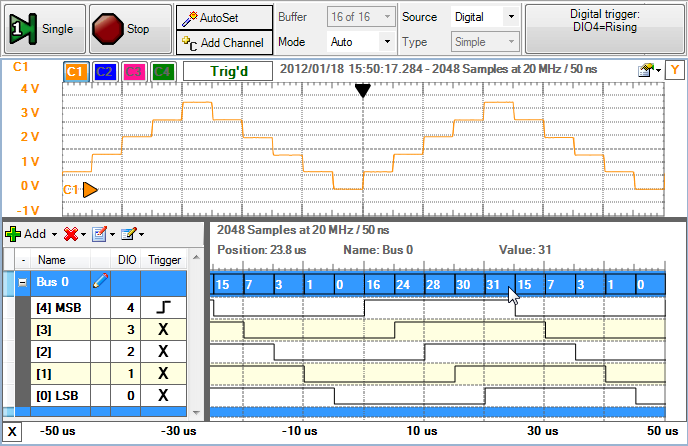
The Logic Analyzer can be enabled inside the Oscilloscope interface by adding digital channels from acquisition toolbar, or by enabling from the view menu or main toolbar.
The picture below shows the analog R2R output of a Johnson counter.
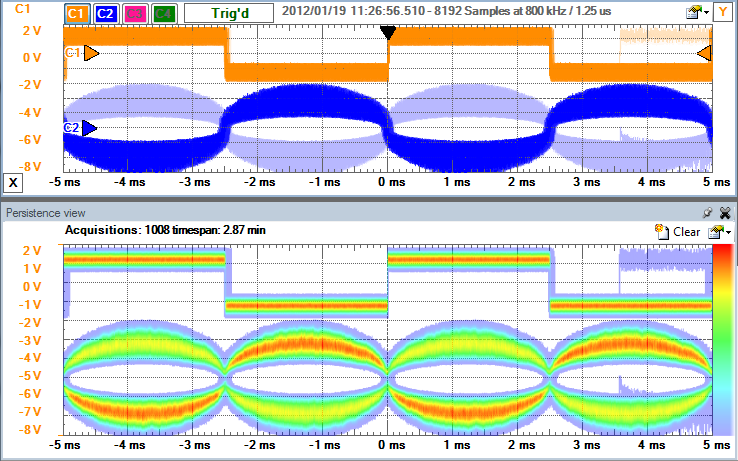
Persistence view superimposes multiple waveform acquisitions on the same view. The more frequent waveforms are drawn with hotter colors than rare ones. The view is cleared by the clear button or after making any configuration change.
This view is useful to detect glitches, or to catch a rare event in a series of repeated normal events. The areas of the view that have the highest density are red (hot), while the areas with the lowest density are blue (cold). The persistence is infinite.
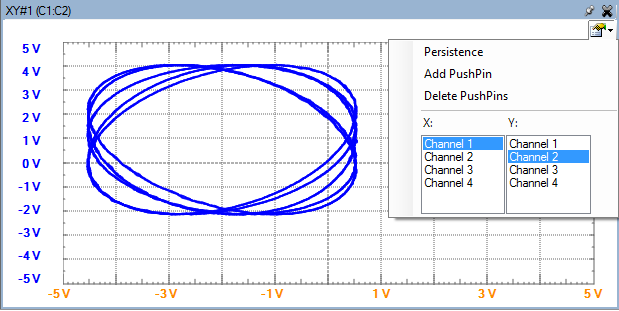
Using the XY view lets you plot one channel against another. This plot could be the I-V curve of a component such as a capacitor, inductor, or diode, or a Lissajous figure showing the phase difference between two periodic waveforms. XY view is also capable of more advanced operations, such as plotting a math channel against a reference waveform.
The properties button in the top-left corner opens a drop-down to select the channels for X and Y representation.
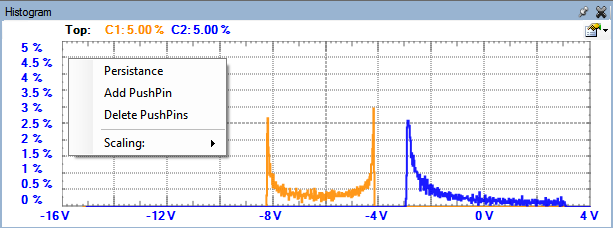
A histogram is a graphical representation of the voltage distribution in a signal waveform. It plots the distribution of values for each voltage value, with the number of times the signal has a certain voltage value represented as a percentage.
The picture below shows the histogram view of a sine and another signal.
The properties button in the top-left corner or mouse right-click opens a drop-down to select scaling, to enable/disable persistence and to add/remove pushpins.
The FFT view plots amplitude against frequency. In other words, it shows signals in the frequency domain, as opposed to the time view which shows signals in the time domain, amplitude against time. It is especially useful for tracking down the cause of noise or distortion in measured signals.
See Frequency spectrum and FFT
for more information.
For the analysis FFT Window Functions
are used to reduce unwanted artifacts that are created during the FFT
process.

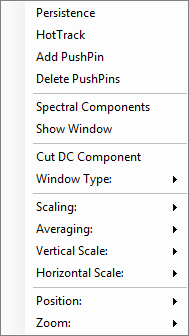
The drop-down button (in the top-right corner) contains the following
options:
Dragging the top or bottom corners with the left button moves the visible position in the spectrum analysis. Right button dragging changes the applied zoom level. Click the plot area to show a pop-up with frequency and levels for each channel in the corresponding point.
The spectral components list displays the amplitude and frequency of the 32 most important components from the signal spectrum. The list is ordered by amplitude.

In the screenshots below, Hamming and Rectangular window filters were used for FFT process for the same sine (yellow) and rectangular (blue) input signals.
See
Window Functions for more information.


The Data view displays the acquisition samples and the time stamps.
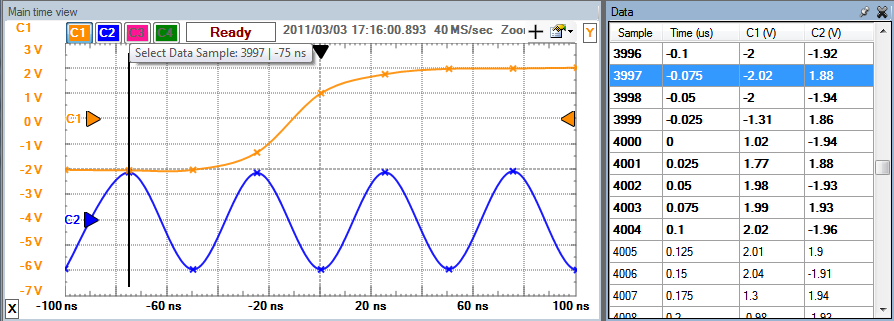
The first column shows the sample index, the second shows the time stamp followed by the values for channels.
The visible samples are marked with bold. When making a new acquisition, or changing the time base or position, the list is scrolled so the first row is the first visible sample. For data in zoom view, changing the selection parameters will also scroll the list.
The selected cells can be copied and pasted to other applications (like Microsoft® Excel™ ).
The Measurements view shows the list of the selected measurements. The first column in the list shows the channel, the second shows the type, and the third shows the measurement result. At the top are Add and Remove buttons and up and down buttons to change the order of the measurements in the list.
Pressing the Add button opens the Add Measurements window. On the left side is the channel list, and on the right side is a tree view containing the measurement types in groups. Below it is the current value of the measurement and a short description. Pressing the Add button here (or double-clicking an item) adds it to the measurement list.
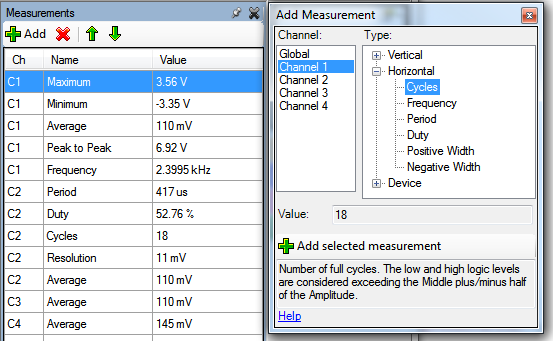
Note: The measurements opened from the main window refer to the main view and measurements opened in selection-zoom windows refer to the selection area.
The Current view displays information about the input levels and triggering frequency, even when the acquisition is stopped.
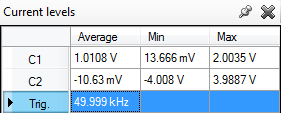
These levels are updated at each second measuring the minimum, maximum, and average of this time period. The frequency is calculated based on the trigger event repetition in this period of one second.
When more than one Oscilloscope instrument is opened, the current levels are valid in the last used (Single/Run) instrument. The others display a "Busy" status.
The audio view can play the data as sound using the default audio output of the computer.

See Events View for more information.
The Zoom views are useful in analyzing a portion of the main view and comparing these segments. In a Zoom window, time, XY, histogram, spectrum, measurements, and cursor views can be opened.
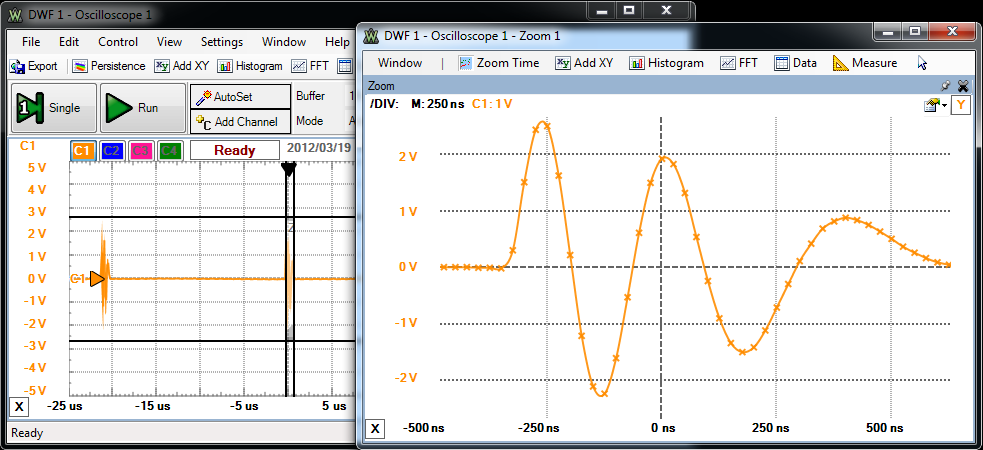
The selected segment is represented in the main time plot by an opaque rectangle. The two horizontal and two vertical cursor lines appear only for the currently active selection.
The selection can be resized by dragging the cursor lines and moved by dragging the rectangle area or by left/right mouse button-dragging in the Zoom Time view.
You can move the selection using the keyboard arrow keys. When you hold the Shift key, the selection is resized. When you hold the Ctrl key, moving or resizing is faster.
The Cursor view displays information about the horizontal and vertical cursors that define the selection rectangle for the Zoom view.
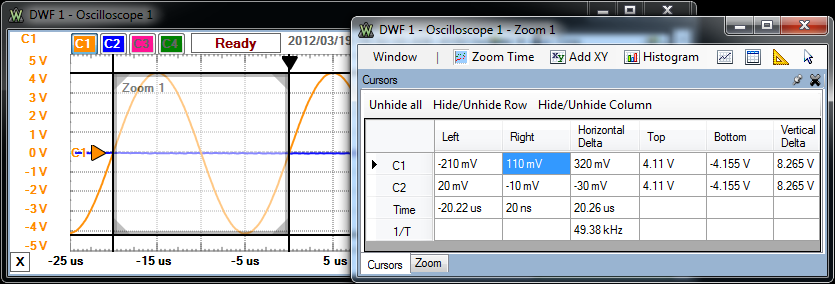
For each channel the columns Left and Right refer to the vertical
cursor intersection with the channel waveform. The top and bottom value
show the horizontal cursor positions. The delta is the difference between the previous two values.
In the Time row, the positions of vertical cursors and time span are displayed. In the next row, the (1/T) inverse of the time span is displayed in frequency unit.
To hide or unhide a row or column, double-click on the header cell. To unhide everything, double-click on the top left corner.
Using the Record window, a longer acquisition can be saved to CSV or WAV format.
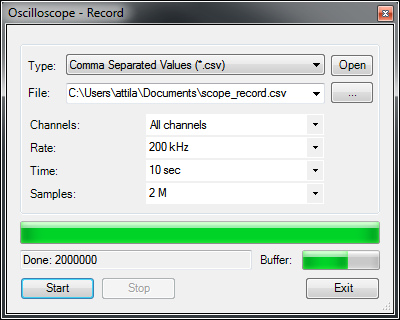
Parameters in this window:
The long progress bar shows the progress of the recording and the buffer shows the fullness of the device buffer. If the device buffer gets filled the recording will lose acquisition samples. If this problem occurs stop other instruments or quit applications that burden the computer or reduce the recording rate (frequency).
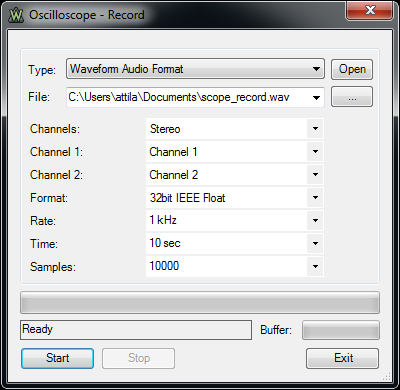
The WAV files have the following addition options:
The Save Project command stores the oscilloscope instrument state (configuration, opened views, data, etc.) in a file that can be loaded later.
The Save Acquisition Data command stores the current acquisition data and trigger configuration information to a file. You can open this file later, or use a channel from it as reference.
The Export dialog lets you save the data or screenshot from the main time view or other views. The data can be saved as CSV (Coma Separated Values) or TXT (Tab Delimited Values). By checking the save options, the following information will be also saved:
In order to import the CSV file in Mathworks-MatLab, with csvread function uncheck Comments and Header, for DesignSoft-TINA application check both.
The screenshot image can be saved
in BMP (Bitmap), PNG (Portable Network Graphics), GIF (Graphics
Interchange Format), TIFF (Tagged Image File Format), JPEG (Joint
Photographic Experts Group) or EPS (Encapsulated PostScript) formats.
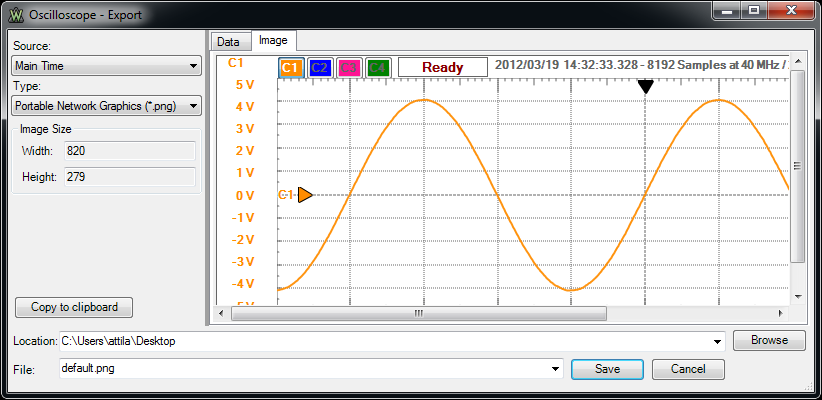
Options that are bolded have been modified from the default settings.
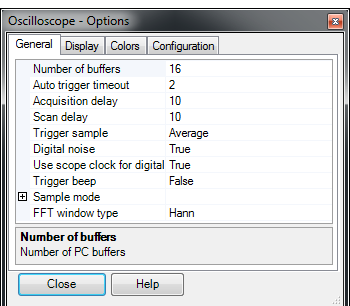
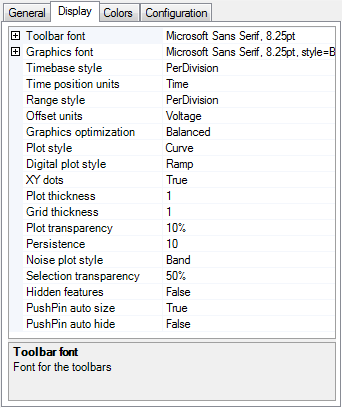
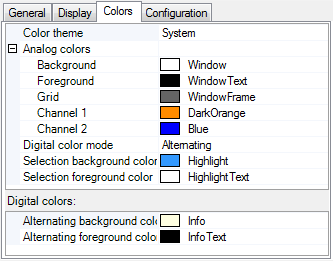
The Colors tab lets you select the color options for: background, foreground, grid, and channels.
Changing the Color Theme loads a predefined set of colors for background, foreground, grid, and channels.
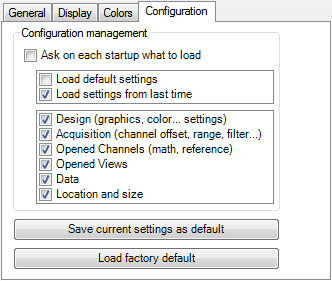
Ask on each startup what to load: lets you select whether the default or last configuration is loaded at start-up, as well as which items to configure.
Save current settings as default: saves the settings you have selected as default.
Load factory default: restores the factory default settings.